 Knowledge Library
Decision in brief
Use Docker stats and scoped logs for an immediate investigation. Add retained container and host metrics once you need trends or alerts across incidents, and add an external request probe for any service whose outage needs a response. Decide what each alert should cause the operator to do.
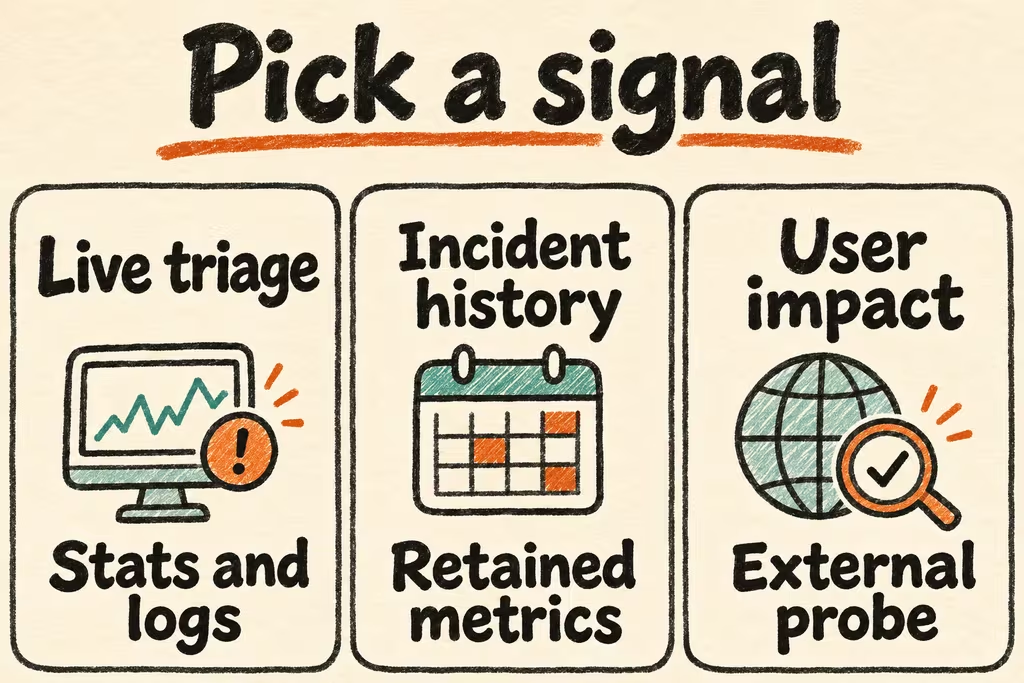
Choose the signal before choosing a collector
Docker stats streams container resource usage such as CPU, memory, and network I/O. Sample it during a live investigation and use a separate collector when you need history after a restart. The Docker Engine Prometheus endpoint exposes daemon metrics. For per-container time series or application measurements, verify what the collector and application explicitly export.
Use stable service names across container recreation, with a container identifier available for drill-down. Collect host disk usage and keep log retention within a budget. Keep collector and daemon access narrowly scoped, particularly if an integration needs access to the Docker socket, and avoid exposing the monitoring endpoint publicly.
| Question | First measurement | Feedback to retain |
|---|---|---|
| Which container is currently using memory? | docker stats and the configured limit | Memory trends, OOM indications, and deployment times |
| Can users complete a normal request? | Probe a representative endpoint from outside the host | Success rate and latency with meaningful alert windows |
| Is disk exhaustion approaching? | Host filesystem and log growth | Time to exhaustion, retention behavior, and free space after cleanup |
| Did a deploy cause a restart or outage? | Container events, structured logs, and release markers | Timeline tied to service and image for the on-call responder |
What two HN monitoring projects illustrate
indigodaddy posted Ctop as a top-like container monitoring interface. That is a useful pattern for immediate triage. Try matching a high-usage container to the service, release, and limit the operator needs to inspect.
In a separate Show HN, benjy3379 presented Maintenant as a single binary for Docker and Kubernetes monitoring. A small collector footprint can simplify deployment. The relevant pilot is whether telemetry stays available after a container is recreated and whether an operator can reach it during a host incident.
Prove alerts with a controlled staging load
- Run an authorized test service and capture a short idle baseline plus one known-good request path. Label data with service, host, environment, and deployed version.
- Apply a bounded load and then stop and recreate the test container. Compare request success, container memory and CPU, event times, and the dashboard's continuity across the new container ID.
- Trigger a short synthetic outage and a disk capacity warning with fixtures. Confirm alerts arrive once at the intended destination, link to the right runbook, and resolve after the service recovers.
- Approve when the alerts detect the test failures within the objective, for example two minutes, and the responder locates service and host evidence within five minutes. Stop if the collector becomes unreachable with the monitored host and there is no independent outage signal.