 Knowledge Library
Decision in brief
Start with Uptime Kuma or Gatus when you need to know whether a service responds from a user's network. Add Prometheus and an alert receiver when you need to track saturation or error rates over time. Add shared log search when engineers regularly need to correlate failures across services. Put at least one availability check outside the system that it monitors.
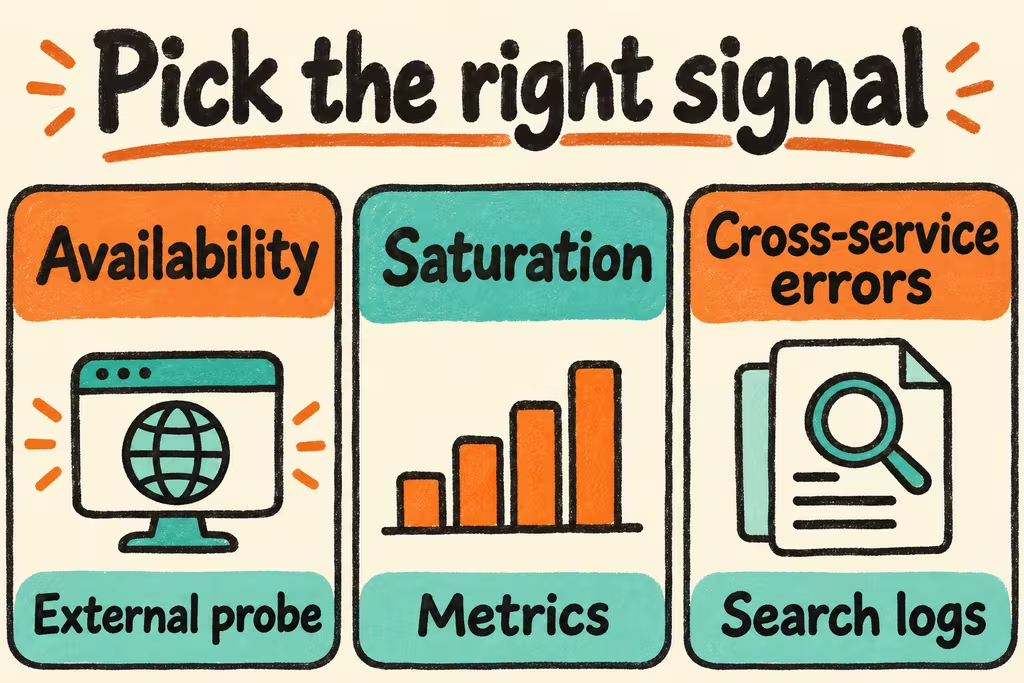
Choose the tool by the operator's first question
Uptime Kuma offers configurable endpoint monitors and notifications. Gatus is a configuration-driven alternative with checks and alerting. Run the probe from a network that represents the user and check one meaningful response condition. For private services, use a probe with scoped private access.
Prometheus stores numeric time series and evaluates alert rules. Alertmanager groups and routes alerts. Loki groups log streams by labels. Keep labels bounded, such as service and environment, and keep unique request IDs in log content or structured metadata so they do not create a stream per request.
| Question to answer | First setup to test | What to measure |
|---|---|---|
| Does the site or private app answer from a user's network? | Uptime Kuma or Gatus on a separate host | Time from a stopped endpoint to an actionable notification and recovery message. |
| Which resource or service is degrading before downtime? | Prometheus with a few workload metrics and Alertmanager | Whether alert thresholds catch staging disk or latency pressure without repeatedly firing during normal changes. |
| Which release, service, or request explains a failure? | Start with readable local logs, then trial Loki if queries span hosts or services | Time to locate a seeded error and identify its release within the desired retention window. |
| Did the monitored host and monitor disappear together? | Independent probe or missed-heartbeat receiver in a separate failure domain | Whether the receiver still alerts when the application and its local monitoring are stopped together. |
Two HN accounts show where tool choice changes
nickweb shared a move from Uptime Kuma to Gatus for off-site checks and reported lower memory use in a setup with eight checks. Use that as a reason to run the same probes and notification checks on both candidates before sizing a small host.
In the Traceway discussion, dominikz described adding time-series metrics after a migration, then endpoint checks and threshold alerts. Later, a release broke application functionality while the uptime check stayed green. Include an app-level transaction or error signal in the trial when basic availability can hide an important failure.
Test the path from failure to response
- Choose one staging service, a probe outside its host, one resource metric, and one test notification channel. Define the maximum time to alert and acknowledge, plus a disk budget at your planned retention.
- Stop the test endpoint and confirm failure and recovery messages reach the intended receiver. Repeat with the local monitoring agent unavailable and verify that the independent check still fires.
- Introduce a harmless staging error while the basic endpoint stays up. Check whether the application-level signal detects it, then locate the summary and matching log while measuring daily storage growth.
- Keep the smallest stack that catches both failures, supplies enough context for the runbook, and fits the retention budget. Stop expanding collection if alerts have no clear action, if secret values reach the logs, or if the monitor goes silent with the workload.