 Knowledge Library
Decision in brief
Start with a short prompt in a fresh session using the same account and model. If the baseline is slow, check Claude Status and test a clean terminal. If the slowdown occurs only in a long session or when a tool runs, use /context, /doctor and a timed tool check to find where the time goes. Change one variable at a time.
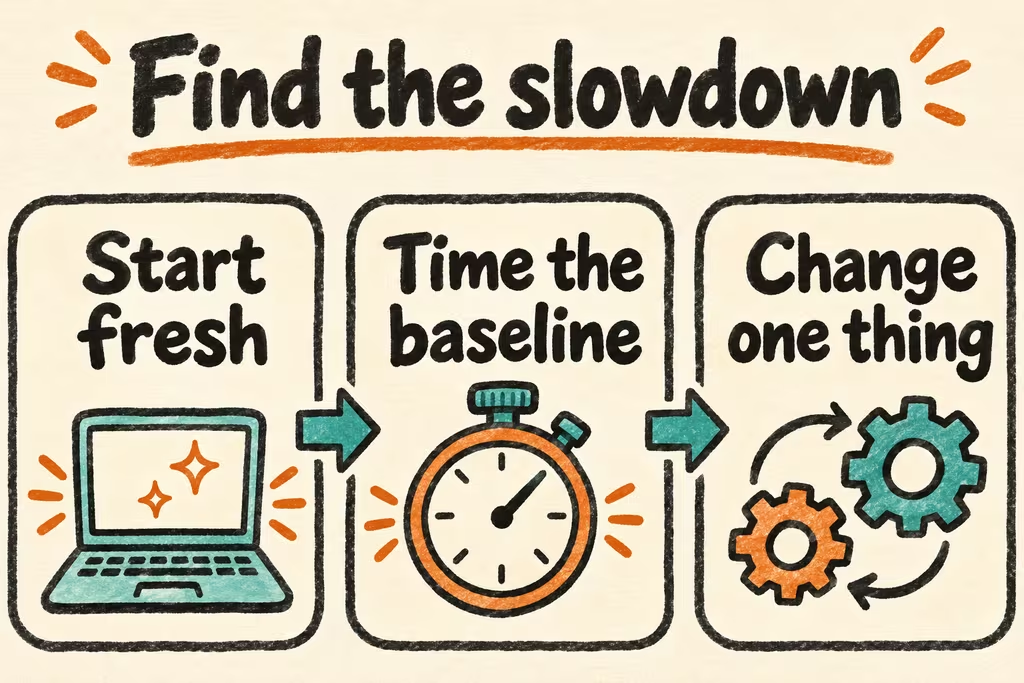
Locate the slow phase
Time startup, elapsed time to first visible output, output generation and tool durations separately. Record version, terminal or IDE, account type, model, effort setting and incident status. A smaller prompt can speed up a memory-heavy session even when the network and model are healthy. Waiting on tests or an approval prompt needs a different fix.
| Symptom | First check | What to change if confirmed |
|---|---|---|
| Fresh short prompt also starts slowly | Claude Status, error and timestamp, clean terminal | Wait out an incident or inspect an approved network path. |
| Only a long session slows down or repeatedly compacts | /context and size of recent tool output | Use /compact or a fresh session with a concise state summary. Narrow the command output. |
| Slow at a hook, MCP call or command | Time that operation separately and compare with a temporary safe-mode session | Repair the slow integration, or scope it to tasks where it is needed. |
| Only terminal drawing lags while work completes | Try an approved terminal or verify IDE rendering settings | Fix the client layer before changing model settings. |
What session reports on Hacker News suggest
achalpandey noted that real Claude Code sessions combine multiple tasks and pauses that can produce cache expiration and growing context. Their proposed benchmark was a work in progress. Use the same short prompt first and then a longer task to see when the slowdown starts.
In a separate thread about a local Ollama migration, fghorow described long prefills with the Claude Code VS Code extension connected to a LAN model backend. That case concerns a custom backend. Managed Claude traffic can behave differently. Compare a fresh versus accumulated prompt on the backend where you actually observe the problem.
Run a controlled latency check
Use a non-sensitive small repository and repeat each condition three times. Report the median first-output time and the slowest total run. Leave permission and network policy intact.
- Time a fresh short prompt and a normal task in the affected session. Note rate-limit or overload messages verbatim without including credentials or prompt contents.
- Time the suspect test, hook or connector separately. For a fresh control session, test without optional customizations using documented safe mode and compare before changing permanent settings.
- Change just one factor such as new session, narrower tool output, or a faster eligible model for the same task. Keep the change only if it reduces the measured bottleneck and still passes the same task checks.
- Stop tweaking local settings during a confirmed provider incident. If repeatable slowness persists, collect sanitized timings and error codes for support and revert any experimental user configuration.