 Knowledge Library
Decision in brief
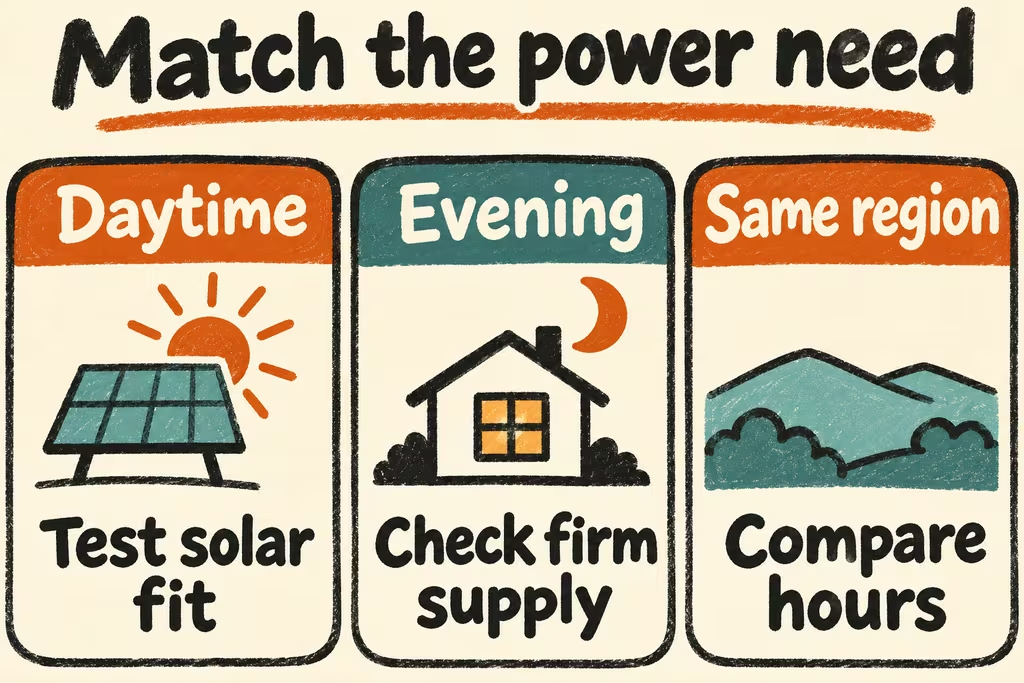
Compare the projects in the same power region for the same service date. Start with utility-scale PV when the need is daytime energy and the connection and site are viable. For an obligation to serve demand through evenings and prolonged shortfalls, compare portfolios that can meet those hours. Those may include solar with storage and firm supply, or nuclear with reserves for outages. Evaluate the economics of keeping an operating nuclear plant separately from building a new one.
Compare nuclear vs solar cost at the level of service you need
Nameplate MW is rated power. Net MWh is the electricity generated over a period. Capacity factor divides generation by the energy that rated capacity could have produced running continuously over the same period. For illustration, 100 MW at a 90% annual capacity factor yields 788,400 MWh, while 100 MW at 25% yields 219,000 MWh in a 365-day year. Use matching AC ratings and actual data for an operating fleet. Output adequacy during stressed hours requires a separate check.
Levelized cost of electricity estimates long-run generator cost per unit of energy under stated assumptions. EIA separates this from the estimated value of electricity and capacity a resource can displace. For comparable reliability, include replacement power, grid work, storage losses and duration, and the capacity credited under local rules. Solar output follows daylight and weather. Nuclear plants have refueling outages and can have unplanned outages. Regional demand and the rest of the fleet determine how much either profile helps.
| Decision | Measure | Control for |
|---|---|---|
| Which option delivers more annual electricity? | Net MWh and capacity factor | Same region, operating period, and treatment of curtailment |
| Which option helps during shortages? | Accredited capacity and output at coincident risk hours | Weather, outage schedules, battery duration, and import limits |
| Which new portfolio costs less? | Delivered cost across options that meet the same obligation | Connection, financing, backup, decommissioning, and time to service |
| Keep or replace an existing plant? | Future avoidable costs, outage exposure, and replacement requirement | Exclude sunk costs from the forward comparison and use the same reliability target |
Two questions to take from the HN discussions
VeejayRampay raised the difference between producing annual energy and being available when called upon in a thread comparing solar growth with nuclear. Test the evening and multi-day weather windows explicitly instead of inferring availability from annual totals.
In a separate thread about a reported Finnish power agreement, ZeroGravitas asked whether purchasing output from a running plant would increase the amount of clean electricity available. Compare the expected output under the contract to a credible baseline without it. Record whether the proposed change would create new output, preserve existing output, or change who buys it.
Test one local comparison before recommending a resource
- Write one comparison brief naming the power region, service date, annual MWh target, peak periods, and applicable reliability test. Separate decisions about operating plants from new projects.
- Download an hourly load and generation series for the same region and period. Mark what the series excludes, then cross-check annual totals with the reporting agency. Flag missing or inconsistent intervals before comparing shapes.
- Run both portfolios through the same difficult hours, including an evening peak, prolonged weak solar output, and a large unit outage. Add the actual connection limits, storage reserve, power and duration. Compare delivered cost under a common price year and schedule sensitivities.
- Advance only portfolios that meet the regional reliability, delivery, and cost criteria entered in the brief. Pause the decision if you lack a usable hourly profile or regional capacity-credit method, or the apparent winner depends on omitted backup or upgrades.