 Knowledge Library
Decision in brief
Start with end-to-end latency, error rate, and traffic by operation. Add database and host metrics that can separate queuing, lock waits, and I/O from time spent executing. Choose alerts that name an owner and a first diagnostic action. Expand query detail only if the extra collection provides useful evidence inside your overhead and data-exposure budgets.
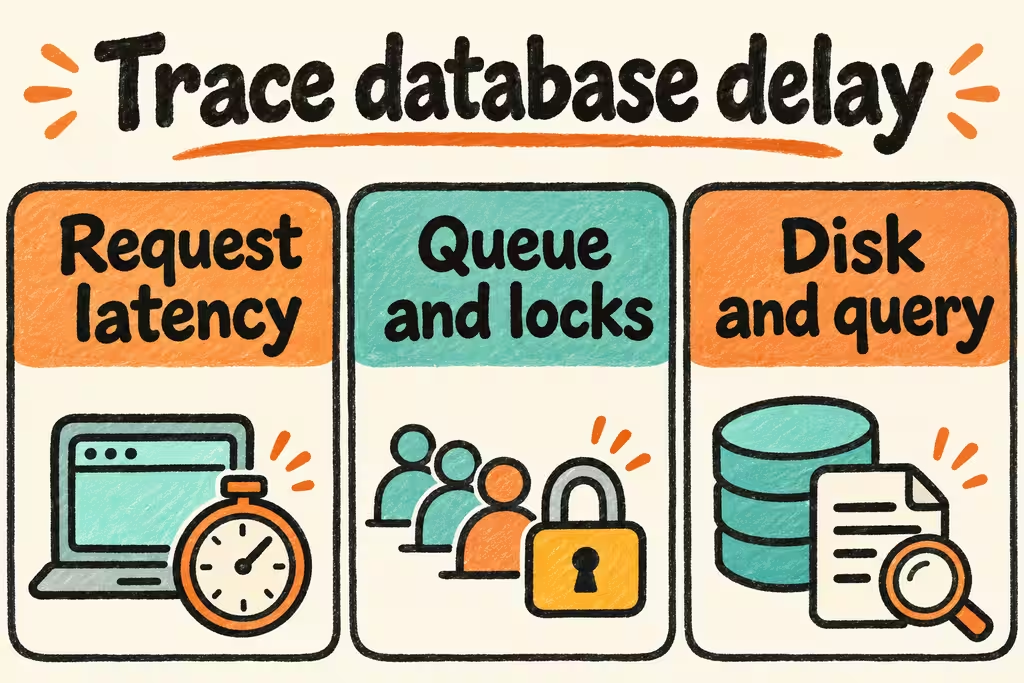
Instrument the same request boundary before comparing engines
Record the duration to acquire a connection separately from the database call and the rest of the handler. Sample peak and ordinary load, then compare equivalent traffic mixes. Capture failures and timeouts alongside successful latencies so slower work does not vanish from the report.
For PostgreSQL, use cumulative statistics and sampled wait events with activity and host counters. For MySQL, select Performance Schema instruments for the events you need. SQLite runs inside the application, so measure database calls, busy retries, and application and disk contention in that process. Prefer normalized statement identifiers and store timing information without raw sensitive values.
| Symptom | First evidence | When to go deeper |
|---|---|---|
| Request p95 climbs while observed SQL time is steady | Connection acquisition, pool wait, request concurrency, and network timing | Inspect the client and pool when requests wait before the database begins processing. |
| Write p95 worsens during a traffic burst | Database wait categories, application retries, disk write latency, and throughput | Inspect lock and I/O evidence before changing storage, indexes, or the number of writers. |
| Only background reads time out | Replica replay lag, report timing, and per-operation volume | Compare the report against the intended endpoint and trace its load on shared resources. |
| Metrics storage or collection grows quickly | Sampling rate, series count, bytes retained, and profiler overhead | Reduce statement detail or retention if it exceeds the agreed cost or confidentiality budget. |
Two HN examples of why metric context matters
In a thread on PostgreSQL storage, iancarroll reported lower observed I/O latency after changing RDS instance types to one with local NVMe. Use the report to choose what to measure, including storage latency and request p95 at the same load. The outcome depends on how the workload uses local storage.
In the PgFirstAid thread, ahachete asked whether an unused-index check included read replicas. Inventory the actual traffic on each endpoint before deciding whether a change is safe. Observe a full cycle that includes infrequent batch and reporting jobs.
Prove alerts with controlled comparison runs
- In staging, record a baseline for normal and peak traffic using a stable synthetic dataset. Set expected request p95, allowed alert delay, and an instrumentation overhead budget.
- Run the same workload with minimal and expanded instrumentation. Compare p95, CPU, storage volume and metric cardinality. Remove samples or labels that cost more than you can afford or carry sensitive values.
- Induce one known bottleneck at a time, such as a short held lock or a small connection pool. Have an operator use the resulting alert and dashboard to identify the bottleneck without seeing the test setup.
- Keep alerts when each test points to the right layer and both detection delay and collection overhead pass target. Stop adding detail when the signals still cannot distinguish request queuing from execution or waiting.