 Knowledge Library
Decision in brief
Start with the SQL that consumes the most total database time or dominates an important endpoint’s tail latency. Capture representative parameter values and inspect its plan. Fix the first meaningful estimate or work mismatch you can reproduce, then compare one change at a time under concurrent load.
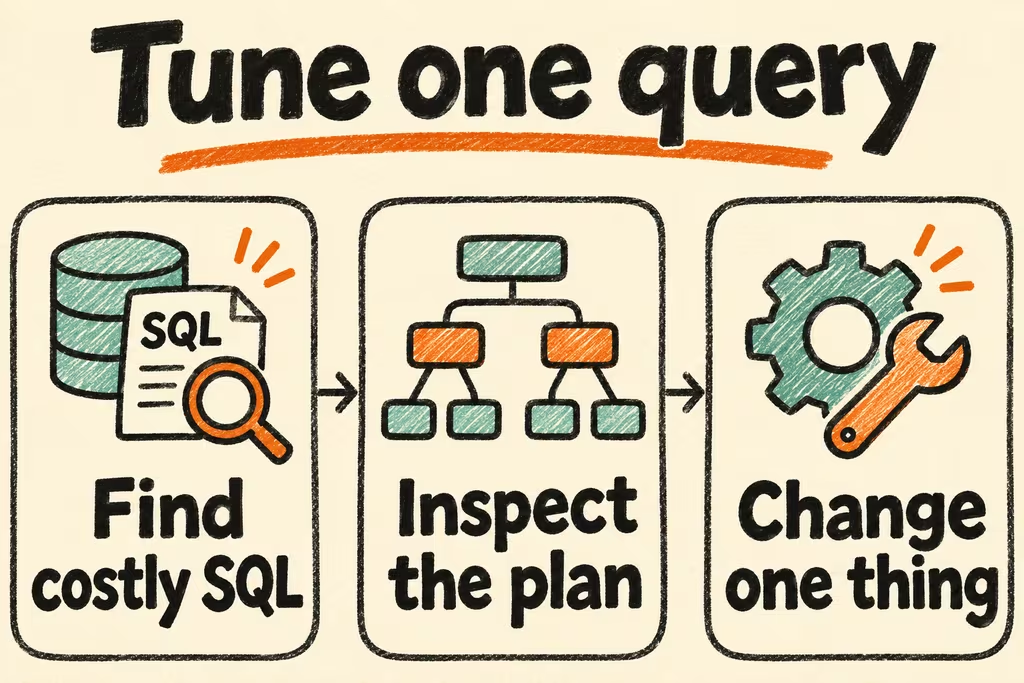
Find the first costly mistake in a query plan
Where available, use pg_stat_statements to find normalized statements by total execution time during a fixed interval. Cross-check those statements with application p95 and p99 traces. The database summary groups executions and gives aggregates, so use traces to find slow individual requests and representative parameter skew.
Inspect plain EXPLAIN before running EXPLAIN (ANALYZE, BUFFERS) on a safe staging read. ANALYZE executes the statement. Compare estimated rows with actual rows and account for loops, filter work, shared blocks and temporary I/O. A sequential scan can be efficient when a query needs a large share of a table. Test common and rare parameter values, especially where the application uses prepared statements.
| Observed signal | First change to test | Evidence to keep |
|---|---|---|
| Early row estimates far from actual values | Refresh statistics and consider extended statistics for correlated columns of the same table | Estimates and endpoint latency improve for multiple parameter buckets |
| Selective predicate still reads many heap pages | Test one index matching the predicate and ordering, or rewrite a mismatched expression | Fewer buffers and lower latency within the write and storage budget |
| Each row is cheap, but the app repeats the query | Batch calls or change the ORM retrieval shape | Fewer calls per request with unchanged results |
| Request slow, execution fast in staging | Check lock waits, pool queueing and app/database round trips | Time is attributed to the component that actually waits |
Two HN checks on benchmarks and specialized indexes
In an HN discussion of an experimental query planner, perrygeo argued that a faster execution plan can still lose once planning time is included and a workload has changing parameters. Measure combined request time and retain the separate planning and execution values where available.
In a separate HN thread about the Biscuit index, out_of_protocol asked for index sizes alongside query timings. Apply the same test to a routine B-tree proposal. Record its on-disk size, update cost and observed query improvement before adding another production index.
Run the same workload before and after one change
Use a staging database with realistic row counts and skew, safe SQL and bounded load. Set pass criteria for result equality, latency, write throughput and index size.
- Capture a slow query shape, its call rate and representative parameters from traces. Keep a common case, a slow case and an infrequent case so the following tests cover selectivity shifts.
- Measure a baseline with the same concurrency, role, client settings and cache warm-up. Capture estimated and actual rows, loop counts, buffer access, temporary I/O and application timing.
- Apply one change, such as updating statistics, adding one index or rewriting a query. Rerun the parameter set and a mixed read-write workload. Compare latency distributions, total database time, results and any write regression.
- Approve when the target endpoint meets the latency goal with equal results and other workload metrics within budget. Stop if a parameter class regresses beyond its allowance or the effect disappears on repeat runs.