 Knowledge Library
Decision in brief
Use SQLite for local application state, indexed lookups and frequent small updates. Use DuckDB for scans, joins and aggregations across large local tables or Parquet datasets. If both jobs matter, keep SQLite for durable application state and run DuckDB on an immutable export. Check how current the analytics must be before adding that second path.
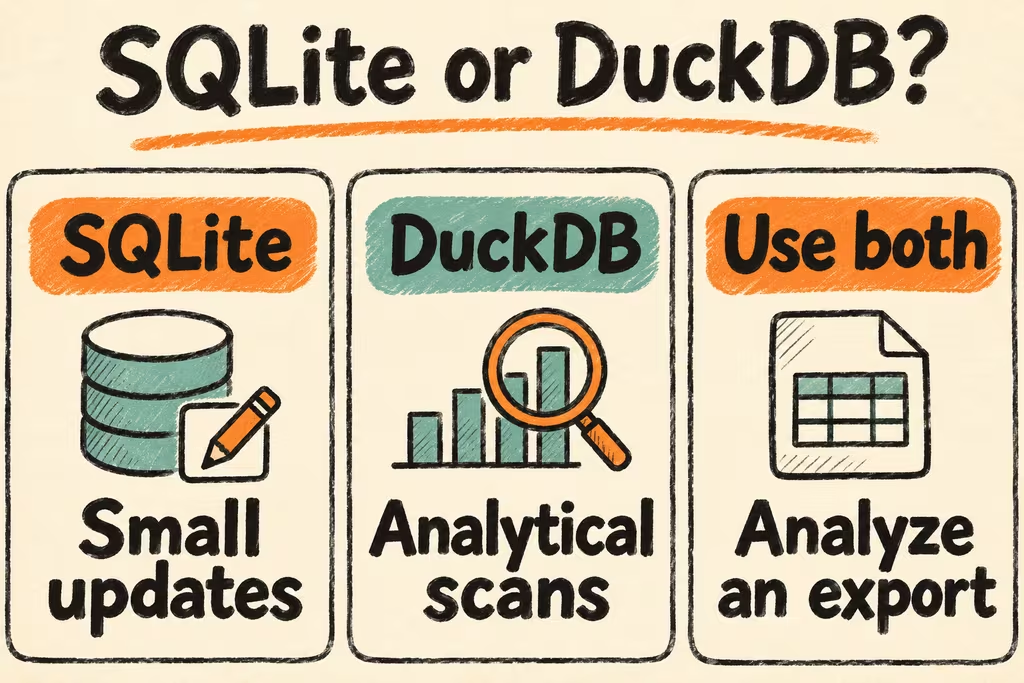
SQLite and DuckDB by query and deployment pattern
The fact that both run inside your application process does not make their strengths interchangeable. Classify your slow query and draw the processes that need to open the database before replacing the engine.
| Job | Starting point | Gate before adoption |
|---|---|---|
| Read or change one record by primary key on every application request | SQLite with an indexed key | Check p99 writes and time waiting for a lock during a burst. |
| Aggregate selected columns across a month of Parquet events | DuckDB querying Parquet directly | Measure scan time, peak memory and spill disk. Check that your filters actually skip data. |
| A CLI and multiple workers need to read while one process writes | SQLite in WAL mode if readers and writer are on the same host and one writer is acceptable | Test the actual process layout, lock retries and checkpoint behavior; switch topology if multiple writers must make sustained progress. |
| An operational app also needs periodic heavy reporting | SQLite for application writes, DuckDB for immutable reports | Publish exports atomically and monitor lag; set a maximum acceptable age for the reporting snapshot. |
How WAL, DuckDB concurrency and Parquet affect the decision
SQLite WAL lets readers overlap with a writer on a local filesystem, but there is still one writer at a time. A long reader can hold back checkpoint progress, so measure WAL growth during the longest realistic report. Do not assume the same setup works across hosts over a network filesystem.
For a DuckDB file opened directly, multiple writer threads can work in one process; multiple processes can open the same file for reading if none opens it for writes. Quack and DuckLake are separate architectures to evaluate if multiple processes need to write. DuckDB can scan Parquet directly and skip unused columns and row groups whose statistics rule out a match. The gains depend on your filters and how the files were written.
What the Hacker News cases add
In the discussion of an analytics migration, coldbrewed reported that counting rows from an attempted whole-internet reverse-DNS scan stored in SQLite could take eight minutes. The author did not report a controlled DuckDB rerun, so this is a useful example of an expensive broad scan, not a measured speedup.
HN commenter aynyc described using SQLite for aggregation with one writer and multiple readers, then DuckDB as a read-only analytics stage; separate tools handled Parquet ingest. The split gives each engine a defined role, but any reporting team adopting it needs to own export failures and freshness.
In a discussion of SQLite generated columns, srameshc reported using DuckDB to explore roughly 20 million records on an M2 MacBook, including aggregate queries over JSON files. The comment has no reproducible timings or cache controls. Use the scale as a prompt to test your own files and queries.
A local benchmark that can separate the two jobs
For overlapping use cases, test native tables populated from the same fixture. Benchmark DuckDB over direct Parquet separately if that is the intended design; document import and export time alongside query time.
- Load one representative event day and one busy week into both engines with the same row count and column types. Run an indexed key lookup, a small durable update, and a GROUP BY over the filtered week. Confirm each result matches before measuring.
- Repeat with cold and warm file caches and fixed resource budgets. Record p95 point-read and update latency, report wall time, peak memory and temporary disk use. Include the time to refresh a representative export if using both engines.
- Open the actual number of client processes and repeat the test while a report stays open. Record busy or lock failures, write queue depth and WAL growth. A solo benchmark cannot accept a multi-process layout.
- If you adopt a two-engine design, publish one immutable snapshot with a timestamp and source watermark. Simulate a failed export: readers should continue using the last complete snapshot and flag it when it exceeds the freshness limit.